Many startups and new initiatives feature high quality videos related to their business. Quite often those startups want to optimize user experience with their content. Having such a great demand that keeps growing has caused many cloud infrastructure providers to appear on the horizon. In this article, I provide our story of choosing the best infrastructure providers for our projects across the world. Our secret is in measuring everything and making data driven decisions as there seem to be no silver bullets around.
There are plenty of ways to deliver video content to people all over the world. The most popular choices are YouTube and Vimeo. Both are capable of delivering even HD content, but free video delivery comes at its own price. Some projects consider it inappropriate to use those kinds of hosting platforms and stick to their own delivery instead.
The main video delivery options are:
- hosting providers – cloud and dedicated servers could be your delivery nodes,
- content delivery networks – content delivery oriented services focused this task
Luckily, almost all of them have trial periods and you are able to check their performance before making your decision.
Estimating Expenditures
One of the biggest challenges when choosing a provider is in calculating expenditures under different choices. This is especially hard when you consider the relatively low predictability of the average startup’s traction. Despite the complexities of expenditure analysis, you still have to do that, as inappropriate expenditure or the wrong business model can ruin even a great idea with a huge demand. Pretend that you are an ordinary user, think of how much content you’re likely to consume. Multiply that consumption by the factor of how many users you need to get onto the next level of traction (I mean to get interest of huge VCs and Customers). You will get the consumption which you need to cover until circumstances are most likely to be changed significantly. The consumption is described by the number of hours to be watched from particular parts of the world. Consider several scenarios and you will get expenditure spread over those scenarios.
Optimizing Quality of User Experience
Nowadays there is no affordable and at the same time well presented in all world areas infrastructure provider. Maybe Akamai and Limelight Networks could be the best in terms of quality but they are simply not well suited for startups. So, you need to find a balance between expenditure and quality for your particular audience. The audience is highly important here as different providers have different advantages in different regions. Optimize for your precious users, rather than hedging your bets and optimizing for potential groups in a vacuum.
That’s why I suggest trying different providers after your early start. You get your first users, you get your first real data. Embed quality tracking code into your video players and check who is the best. The problem here is that usually you don’t have a steady flow of users where you could consistently measure quality of experience. For such a case I suggest using a service like Server Density which offers servers monitoring. You put a several MBs file and track download time from different providers. After some time of monitoring, you will get useful graphs like these:
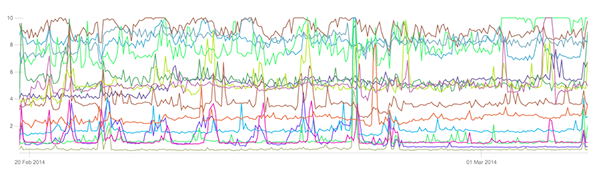
Hetzner (Germany) performance
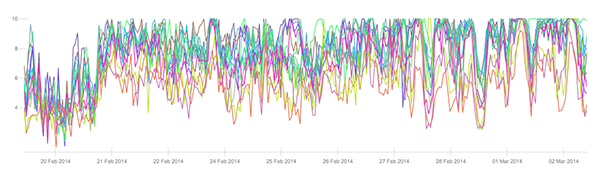
DataShack (US) performance
You may notice that Hetzner performance is quite stable and predictable. At the same time DataShack doesn’t offer the same. For us it was the indicator to search for a better provider. Given that the service was in commercial operations at the time of testing, we could have a really great insight into infrastructure performance under real life circumstances (variant load, network inconsistency).
Video Players Tracking
You can embed Google Analytics tracking code into your video players without serious effort. Flash players usually have plug ins ready. Objective C and Java have their own APIs for measuring quality. I suggest having these kind of events:
- Event Category: «CDN» – to distinguish from all other Google Analytics events
- Event Action: «Download/Upload/Live/VOD/DVR» – to distinguish different content patterns
- Event Label: «Below Low Threshold / Between Low and High Threshold / Above High Threshold» – to grade your users in terms of quality of experience related to their connection speed
- Event Value: minutes of videos – to have understanding of real volumes
After you start tracking the data you will end up with these kinds of reports in Google Analytics:
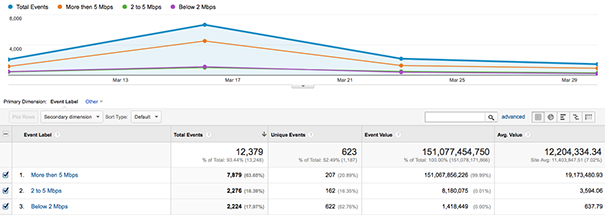
The final tip is to make annotations in Google Analytics for the moments when you change your infrastructure provider or start new trials. This could improve your understanding of changing conditions of your video delivery in graphic form.