This post is also available in: Russian

It is in no way a secret that video statistics and analytics are crucial to any video portal. One of the main rationales behind video statistics is to enable settlements with copyright holders. However it covers a number of other crucial tasks, including:
- Limit the number of parallel viewers using the same account (obviously, you do not wish all friends and relatives of one lucky customer view content under a single account? Well, let them watch it, but at least sequentially rather than in parallel
 ).
). - Prevent viewing of any video to users that have got a subscription by mistake or due to some manipulation,
- Evaluate the quality and popularity of video
- Return to the point where watching was interrupted last time (on any device)
- And, last but not least, enhance the user experience.
Of course, we should keep in mind that, every video portal has specific tasks that absolutely cannot do without the viewing statistics. In this post, we are going to discuss specifics of such a service.
The issue seems quite easy at the first glance, until you have to face that certain mobile platforms fail to support Adobe Flash Player, so to implement a player you have to use HTML5. It may also be the case that a device fails to support socket connections, so the only way to pass data to the analytical service is to use HTTP GET or POST requests (for instance, on some Smart TV platforms). This might severely overload the server. Supporting of this whole "bestiary" is quite a daunting task.
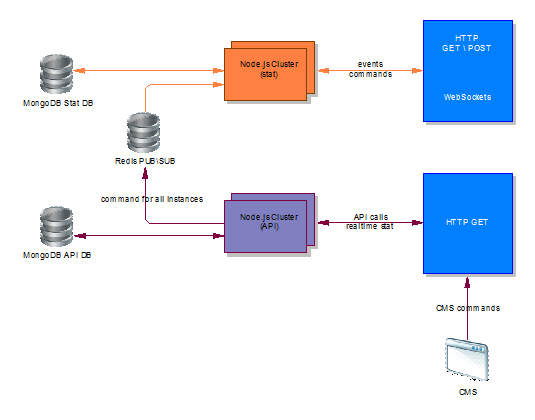
To meet all these challenges, DENIVIP Media has developed its own analytical service based on such technologies as Node.js, MongoDB, Redis, and WebSocket. The solution has been published on GitHub and is available as a cloud-based service.

The project is featured by high performance, distributed operation and reliability. Solution’s architecture enables horizontal scalability of the core components.
Service features:
- Collect statistics via socket connections or HTTP-GET and HTTP-POST requests
- Maintain a comprehensive view log
- Control the number of sessions opened from one account
- Disable video viewing from a specific account
- Retrieve time when the movie watching was stopped. This way, next time the user opens the page s/he can continue viewing from the same point.
- Obtain various data relating to opened viewing sessions or consolidated reporting via HTTP API
- Service Management using a Content Management System (CMS)
The system supports both socket-based connections and common HTTP GET and POST requests. This way you can easily collect statistics from both the classic PC based and mobile Web browsers and, not unimportantly, from mobile apps.
The service is an Open Source solution and is available in our repository on GitHub. A FREE trial of the hosted-version is available right now. Just contact us. ![]()
The demo of the service is available at: http://217.65.3.254:83/index.html. Since the page shows WebSockets based features, you’ll need a WebSockets enalbed browser, such as Google Chrome or Mozilla Firefox. iPad and iPhone also fit well with the task.
On the demo page, you can see statistics collection process (the data is sent to the server every 2 seconds) and the API related operations. You can easily view the number of open user sessions, movie stopped point, and viewing history. The user ID is passed in the URL parameters of the demo page. For more detail on operation and workflow, please visit the Wiki page.
Technical Features
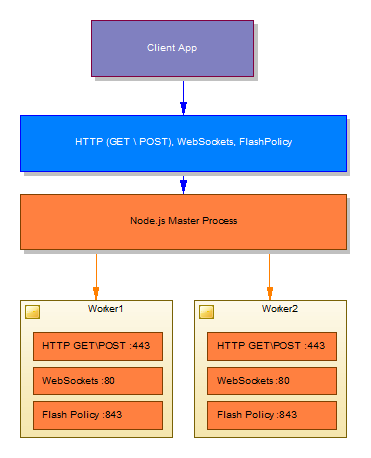
The service can run both within a cluster and as a stand-alone instance. Each node in a cluster may host several node.js processes. Node.js processes in the cluster are balanced at the OS level.
Each node.js service statistics collection process consists of 4 subsystems:
- HTTP GET/POST – by default, it listens to port 443. POST – for devices that support persistent TCP connections, and GET – for other devices.
- WebSockets – by default, it listens to port 80.
- Flash Policy – by default, it listens to port 843. Also, with the /crossdomain.xml GET request to HTTP server via port 443, you can retrieve a policy file using Security.loadPolicyFile
- Command – the server that is subscribed to the Redis channel to send commands to each of the node.js instances

Statistics storage is MongoDB.
The service has been developed and tested with node.js v0.8.2. Also, you’ll need the following modules:
- log4js
- websocket
- mongodb
- redis
- underscore
- deteformat
The modules come with the project repository. Also, you’ll need MongoDB 2.0.4+
Service Installation
- Copy the service source code from GitHub to the relevant directory
- Although all the modules you need to run the service are pre-built, you may need to rebuild them with NPM. For this purpose, go to the project directory and run the command:
1npm install
— the list of necessary modules is specified in package.json and will be processed automatically on running the above command. The "hub" module is provided for the other modules to enable ease of access, so it is not installed with npm and requires no installation and build.
- Create two databases in MongoDB: statslog and apiaggregates
- In MySQL, create a database to upload data from MongoDB with appropriate permissions
- Customize the configuration files
- Run the service statistics node
1stat/index.js
- Run the API request handling service
1node api/index.js
Service Setup
To configure the service, use config.js. This file configures both the service part in charge of data collection (stat) and the part responsible for API calls processing (api).
For more details on configuration options, please refer to the service documentation at GitHub.
To conclude…
Although the service has no native reporting, you can implement it using the API extension or a direct access to a MySQL analytical database. Both options have their pros and cons. Obviously, this is going to become the focus of our next discussion.
Stay tuned! ![]()