This post is also available in: Russian

If you offer online video services, no doubt you have not once thought of video views analytics. In a Flash-based OSMF framework, there is GTrackPlugin to collect statistics on content viewing. Also, you can also use our OSMF Video Analytics.
However, if your service HTML5 based, you need a purpose designed viewing analytics. To build such a plugin, HTML5 Media API should be used. For more on this API, read this post on HTML5 player implementation.
HTML5 Video Analytics
The main idea behind video analytics is collecting the data regarding:
- User interests (to recommend relevant content)
- Video exit time
- View count
- Client to server connection quality
- Full video file buffering time
- Content playtime
- Video seek history
- Playback issues
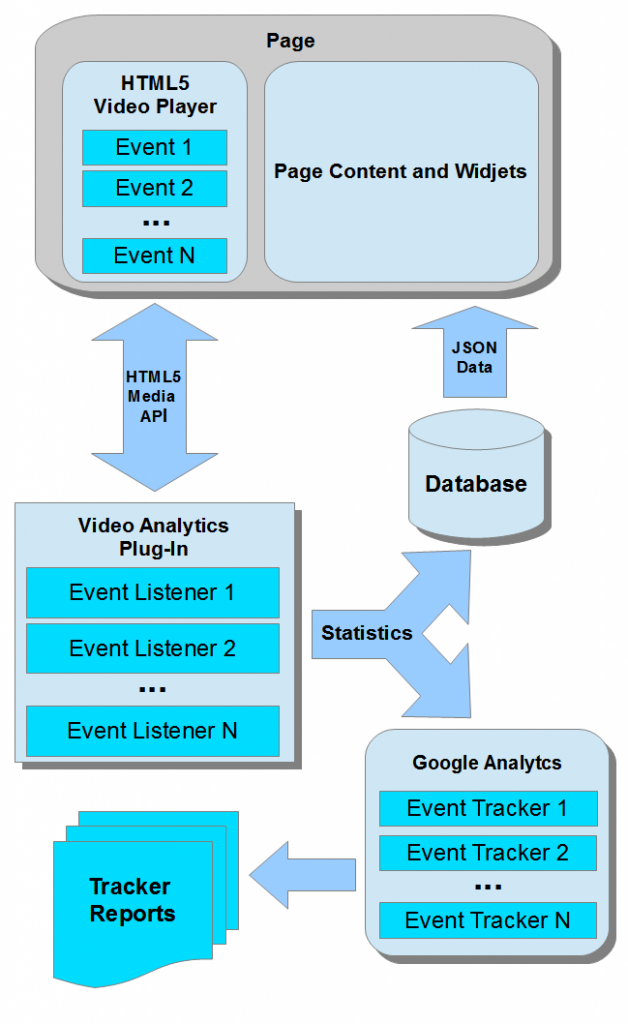
Below is a flow chart for the HTML5 Video analytics system.
The Analytical data collection module is written in JavaScript, as this language is compatible with Media API. This plugin subscribes to the video playback events. When the events occur, the plugin collects data from the player. In order to subscribe, the addEventListener() method is used. Example:
vplayer.addEventListener("loadeddata", onLoadedData);
vplayer.addEventListener("loadstart", onLoadStart);
vplayer.addEventListener("seeking", onSeeking);
vplayer.addEventListener("seeked", onSeeked);
vplayer.addEventListener("canplay", onCanPlay);
vplayer.addEventListener("canplaythrough", onCanPlayThrough);
vplayer.addEventListener("waiting", onWaiting);
vplayer.addEventListener("stalled", onStalled);
vplayer.addEventListener("suspend", onSuspend);
vplayer.addEventListener("playing", onPlaying);
vplayer.addEventListener("timeupdate", onTimeUpdate);
vplayer.addEventListener("ended", onEnded);
Here are the most typical events for Google Analytics:
- Too narrow Web access bandwidth – video buffering rate is substantially slower than the video bitrate
- Too long video start delay, e.g., more than 8 seconds
- Video start time
- Video viewing percentage
- Video views by categories and names
- Buffering count
- Buffering duration
Data Accumulation
Next, the analytical module has delivers the data to the database and to Google Analytics to generate reporting.
To transfer the data to the database, a backend method with relevant parameters is used. This action should not be executed each time the event has occurred, as this would generate excessive load on the server. So you should accumulate data in an object to send it to the database at a certain periodicity. Based on the data, you can adapt content selection and presentation on the page.
In contrast to the database, the data should be sent to Google Analytics immediately on event. For this purpose, the push() method is used:
_gaq.push(['_trackEvent', eventCategory, eventAction, eventLabel, eventNumber]);
where eventCategory is the event category (the first level of event differentiation), eventName is the event name, eventLabel is the event label, and eventNumber is a numerical parameter of the event (count or something else). For more on Google Analytics, please visit this page.
Statistical Analysis
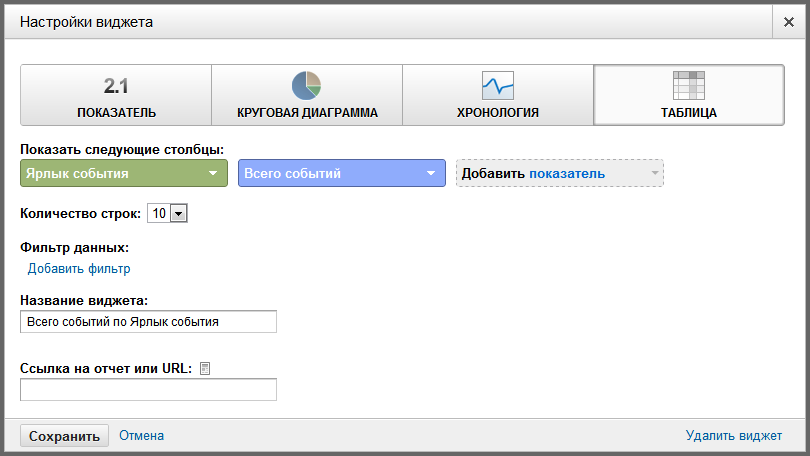
To analyze the data collected, make yourself familiar with Google Analytics GUI. To display the data, click in the right frame to create a new dashboard. To this dashboard, add a new widget with the following options:
Alternatively, you can use the Google Analytics API. Shortly, we’ll update Analysis Ninja with predefined reports.
Ready-Made Solution
Here you can download our solution to pass the player events to Google Analytics. This analytical plugin is added to the HTML5 player demo.
To add the plugin, add the following code to the video output method:
if (trackVideo) { // Detect whether the analytical plugin has been added
  // Create the plugin settings object
  var analytics_options = {
    UserID: 0,
    ContentID: 0,
    ContentName: video.name,
    ContentCategory: "Some Category",
    // Live or VOD tracking
    ContentType: "VOD",
    CookieKey: "VideoAnalytics",
    // Current position rewrite period
    CookieInterval: 30000,
    ContentType: "VOD",
    // Video Start Time levels in seconds
    vslevels: [4,8],
    vsalert: 8
  }

  this.analytics = new trackVideo(player,analytics_options);
}
If the analytics has started, then the "Network" tab of your browser debugger window will show the following requests:
Also, the console will show the following messages:
[Video Analytics] HTML5 loadstart event
Summary
Now you know that video analytics is in no way complex. Most important, you have to define the measures to be analyzed and then build your analytics around such measures.


