This post is also available in: Russian
In this article we will go through the exciting service which let you publish online video analytics from your Flash Player to your Google Analytics account. All you need is to put small actionscript code snippet inside your video player. It collects all statistics data and publishes them to Google when possible. Interesting thing that it works in embedded players also. In case you ever dream for TubeMogul video reports inside your Google Analytics panel then your time has come! Start using it right now – it is free, at least during beta.
Product page with actual information is here.
Features
Online video analytics could be useful for you in case you need:
- Measure CDN performance or your inhouse content distribution platform
- Get an insight on video quality
- Monitor business metrics of your video (amount of views, viewed time)
- Analyze user experience and video quality perception
- Configure video profiles optimized for real users profiles
This service could help you to measure (please note that we constantly adding new reports here):
- Distribution of video start duration – three customizable levels of video start delay across your visitors
- Distribution of rebuffering amount during video view
- Distribution of users bitrates
- Average video start duration
- Average rebuffering amount
- Average time spent on rebuffering
- Average bitrates
- Total video view time
- Total traffic
- Video view time (with item names and categories)
Video analytics service works inside Flash Player and doesn’t use JS, hence it is able to measuer embedded video players also.
Tracking code installation
Tracking code installation is made really simple.
1. Download tracking code here.
2. Unzip package archive (com.statistics.video.*) and include it in your Flash Video Player.
3. Import service loader
1 | import com.statistics.video.StatLoader; |
4. Create tracker right after NetStream object construction
1 2 3 4 5 6 7 8 9 10 11 12 13 14 15 16 | // Create object stat = new StatLoader(); // Get default parameters var cfg:Object = stat.getDefaultCfg(); // Put content item name (for reports) cfg.m_sItemName = "My super video"; // Put content item category (for reports) cfg.m_sCatName = new String("Live"); // Init modified configuration stat.init(cfg); // Add loader on stage (required) stage.addChild(stat); // Push NetConnection stat.setNetConnection(nc); // Push NetStream stat.setNetStream(ns); |
All you need (as shown above) is to create StatLoader object, configure it, add it to the Stage, and push NetConnection and NetStream objects into the StatLoader. All the work with events collection and measurement is done by service.
Tracking code configuration
Please check StatLoader.as file and method
1 | getDefaultCfg() |
– there are comments for all available parameters. You could fine tune them for better abd more usefull reports in GA.
Watching reports in Google Analytics
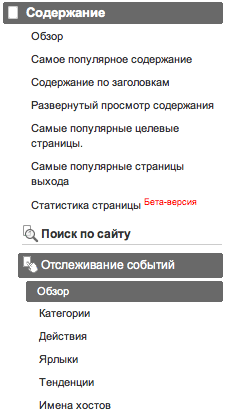
All reports are placed in “Content” section, “Event Tracking” subsection. This is very useful Google Analytics mechanism for custom data tracking and it gives you full power of Google Analytics platform: segmentation, filtering, navigation.

You may watch video reports in many different modes and with different types of visualization. Don’t forget about Google Analytics common features like segmentation/filtering. As example, you may check bitrates only in specific region or only among paying customers.
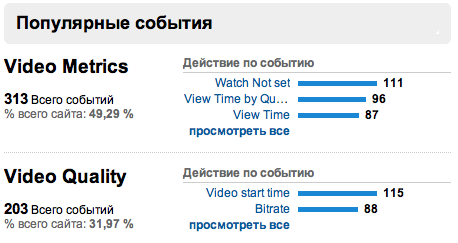
“Event Tracking” dashboard gives you several video reports to start with.

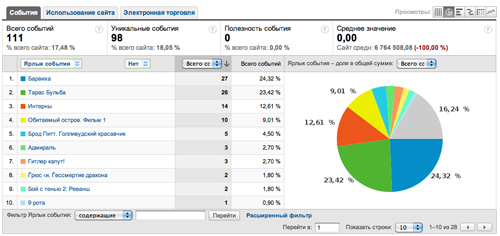
As example, video viewed report in Pie mode could show you shares of your most popular videos:

Video start duration could show you what is the most popular delay in video start playing among your site visitors. Sample view is below:

How it works
Actually, StatLoader loads tracking core which listens to all NetStream, NetConnection and NetGroup events and based on them triggers Google Analytics to store events. All events tracking is optimized to trigger only once per session as amount of events is limited.
Soon
A little bit later we will publish handy AIR application for comfortable video reports viewing – there will be a lot of predefined reports based on collected data. AIR application is working through Google Data Export API.
We will be very glad for your feedback and proposals.
